It is difficult to measure the frequency response of speakers because microphones do not have a flat frequency response, and the resonate frequencies of a room make some frequencies louder than others. However, if we keep these variables consistent, we can learn about the performance of a pair of speakers by comparing them with other monitors using the same room and the same microphone.
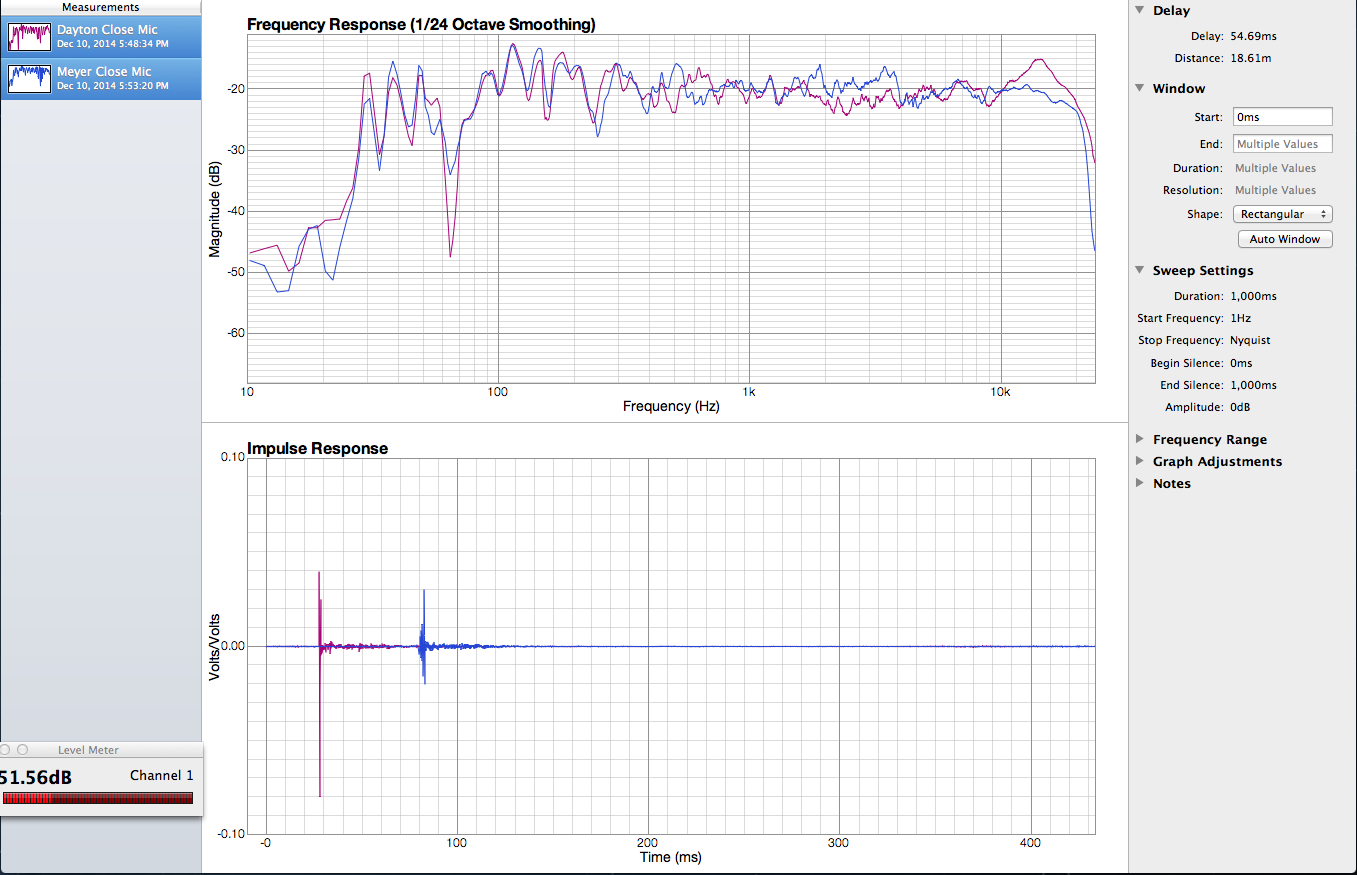
The image above shows the frequency response of my BR-1and a Meyer Sound speaker which I believe was an HD 1. These measurements were made with the program Fuzz Measure, the Dayton Audio EMM 6 microphone, and my Presonus Audiobox audio interface.
The most noticeable difference between the two speakers is the peak between 10kHz and 20kHz in the BR-1s and the deep trough between 60 and 70 Hz.
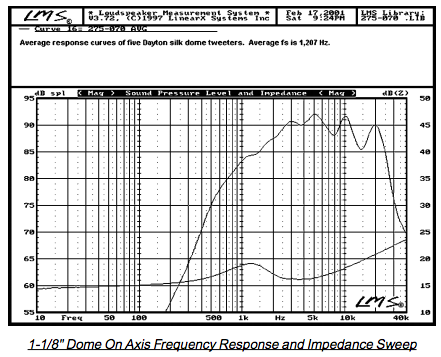
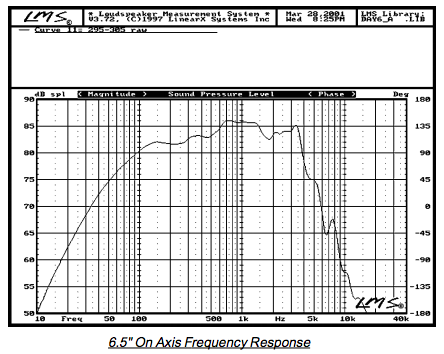
Here are the frequency response graphs for the individual drivers given in the manual.
.
The stark differences suggest that my measurements were greatly influenced by the room modes. To try to compensate for this, I took measurements from many different locations around the room and averaged them.
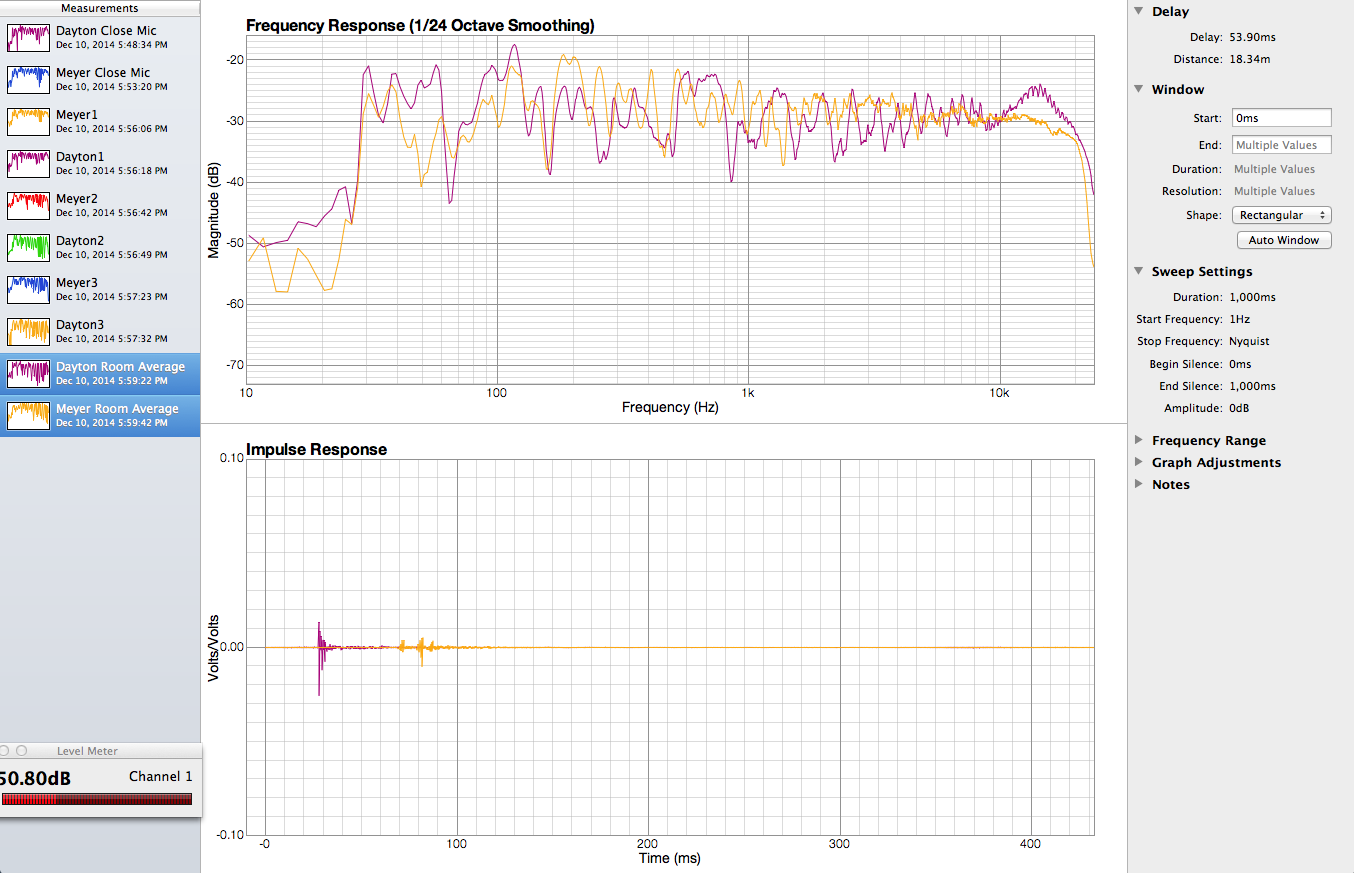
The effects are noticeably reduced, and with a high enough sample size, could become negligible. However, it should also be noted that the resonant frequency of the port tube is 43 Hz– one of the peaks both graphs.
